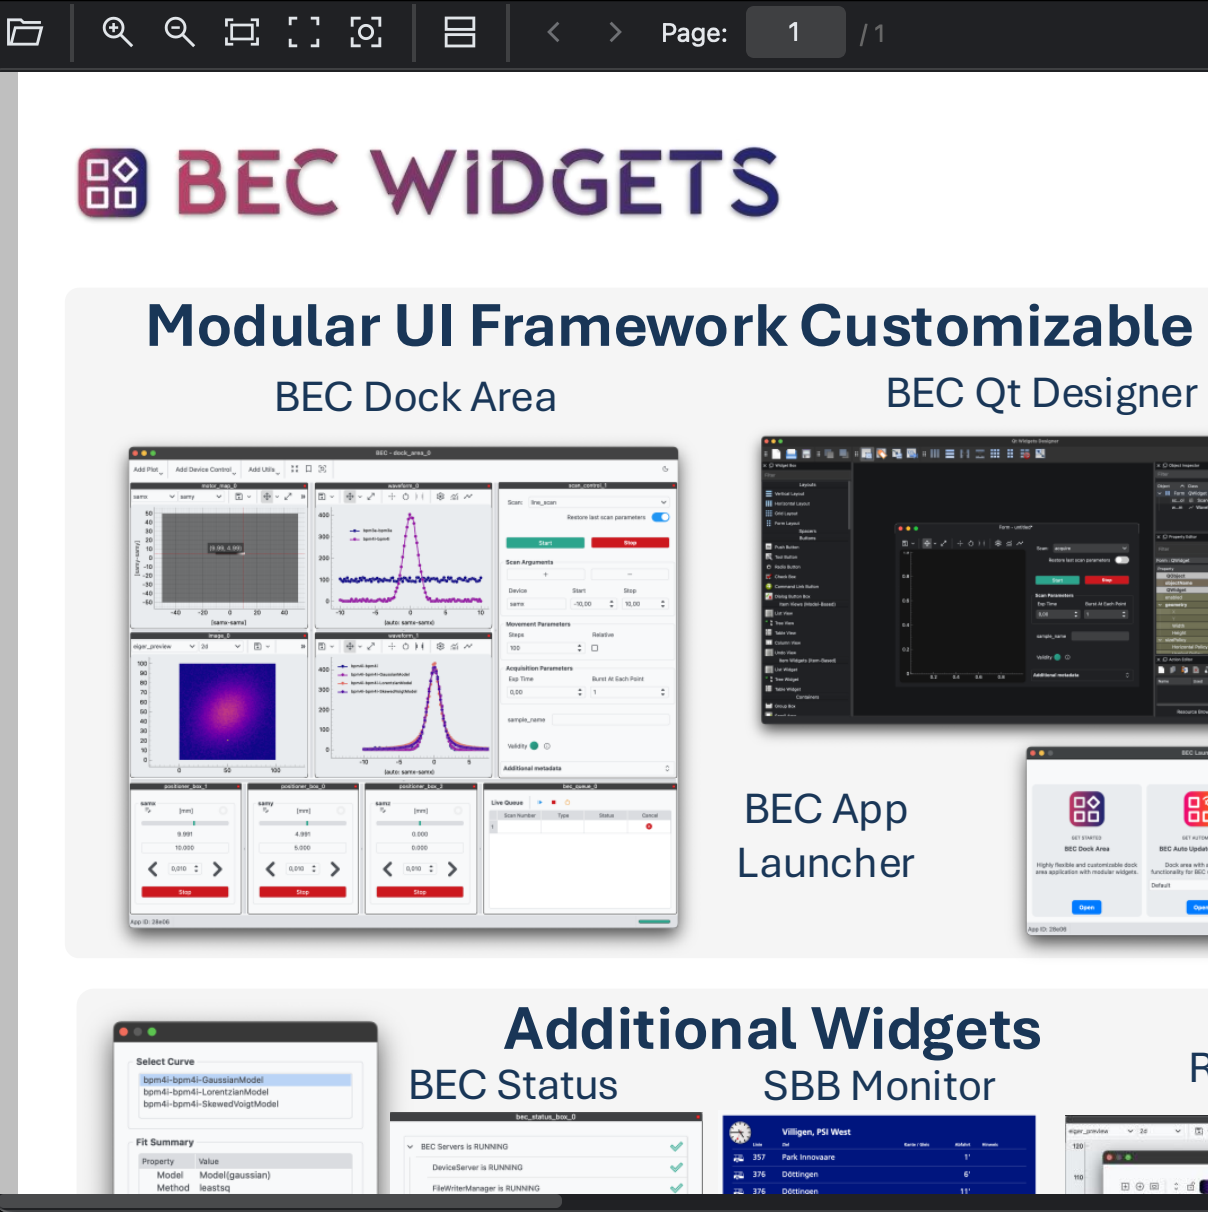
Widgets#
BEC Widgets offers a range of tools designed to make data visualization in beamline experiments easier and more interactive. These widgets help users better understand their data by providing clear, intuitive displays that enhance the overall experience.
Widget Containers#
Serves as containers to organise and display other widgets.
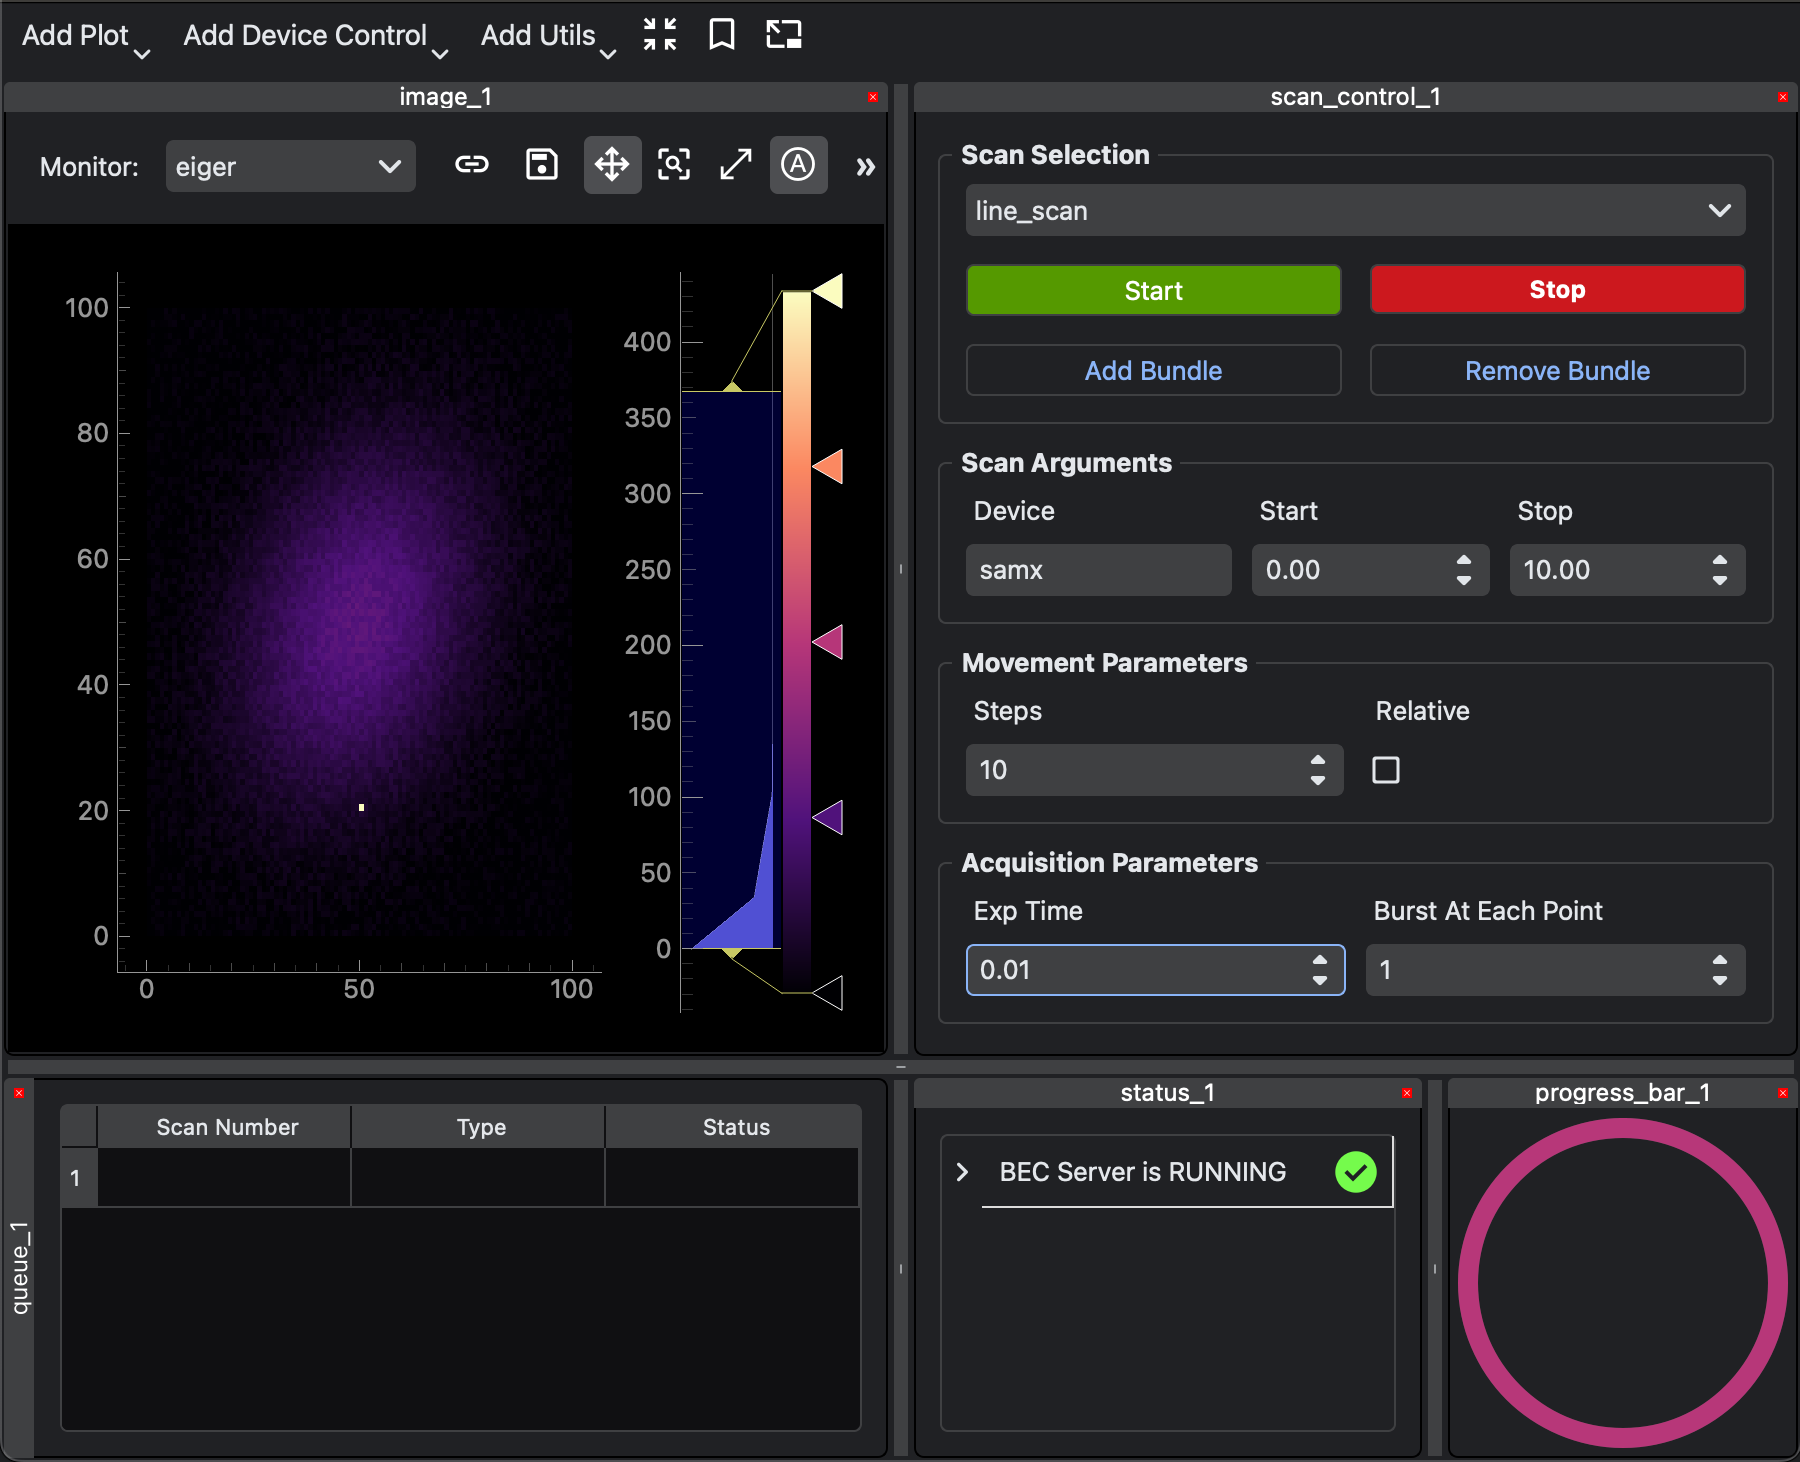
Quickly build dynamic GUI.
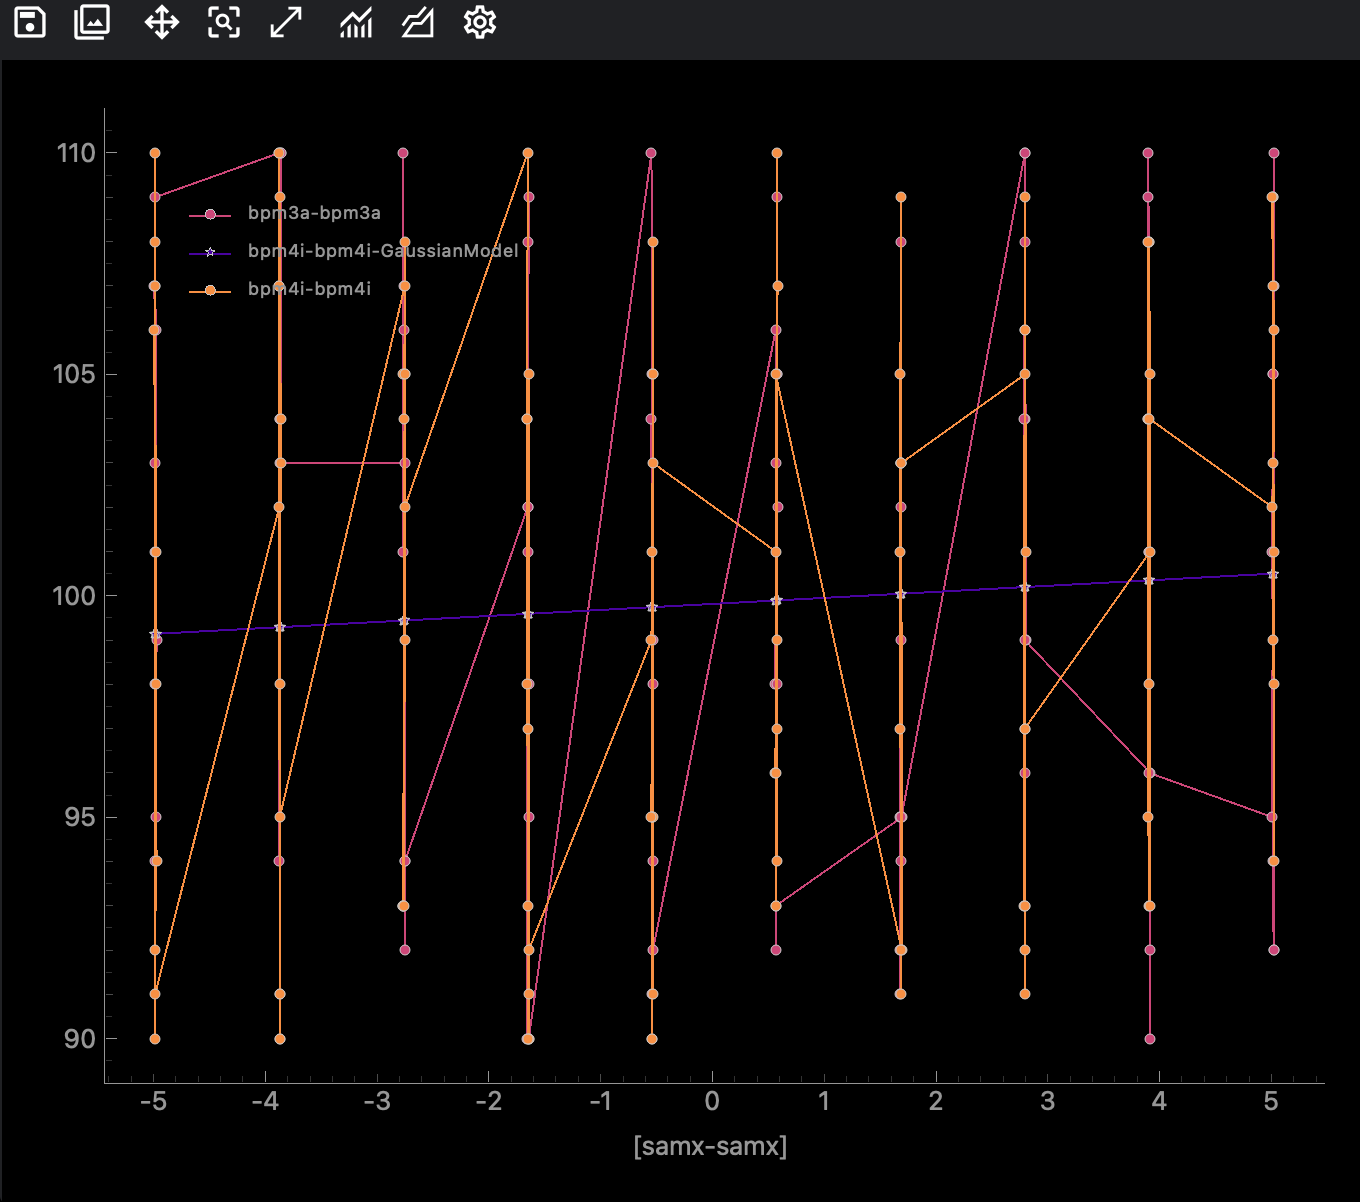
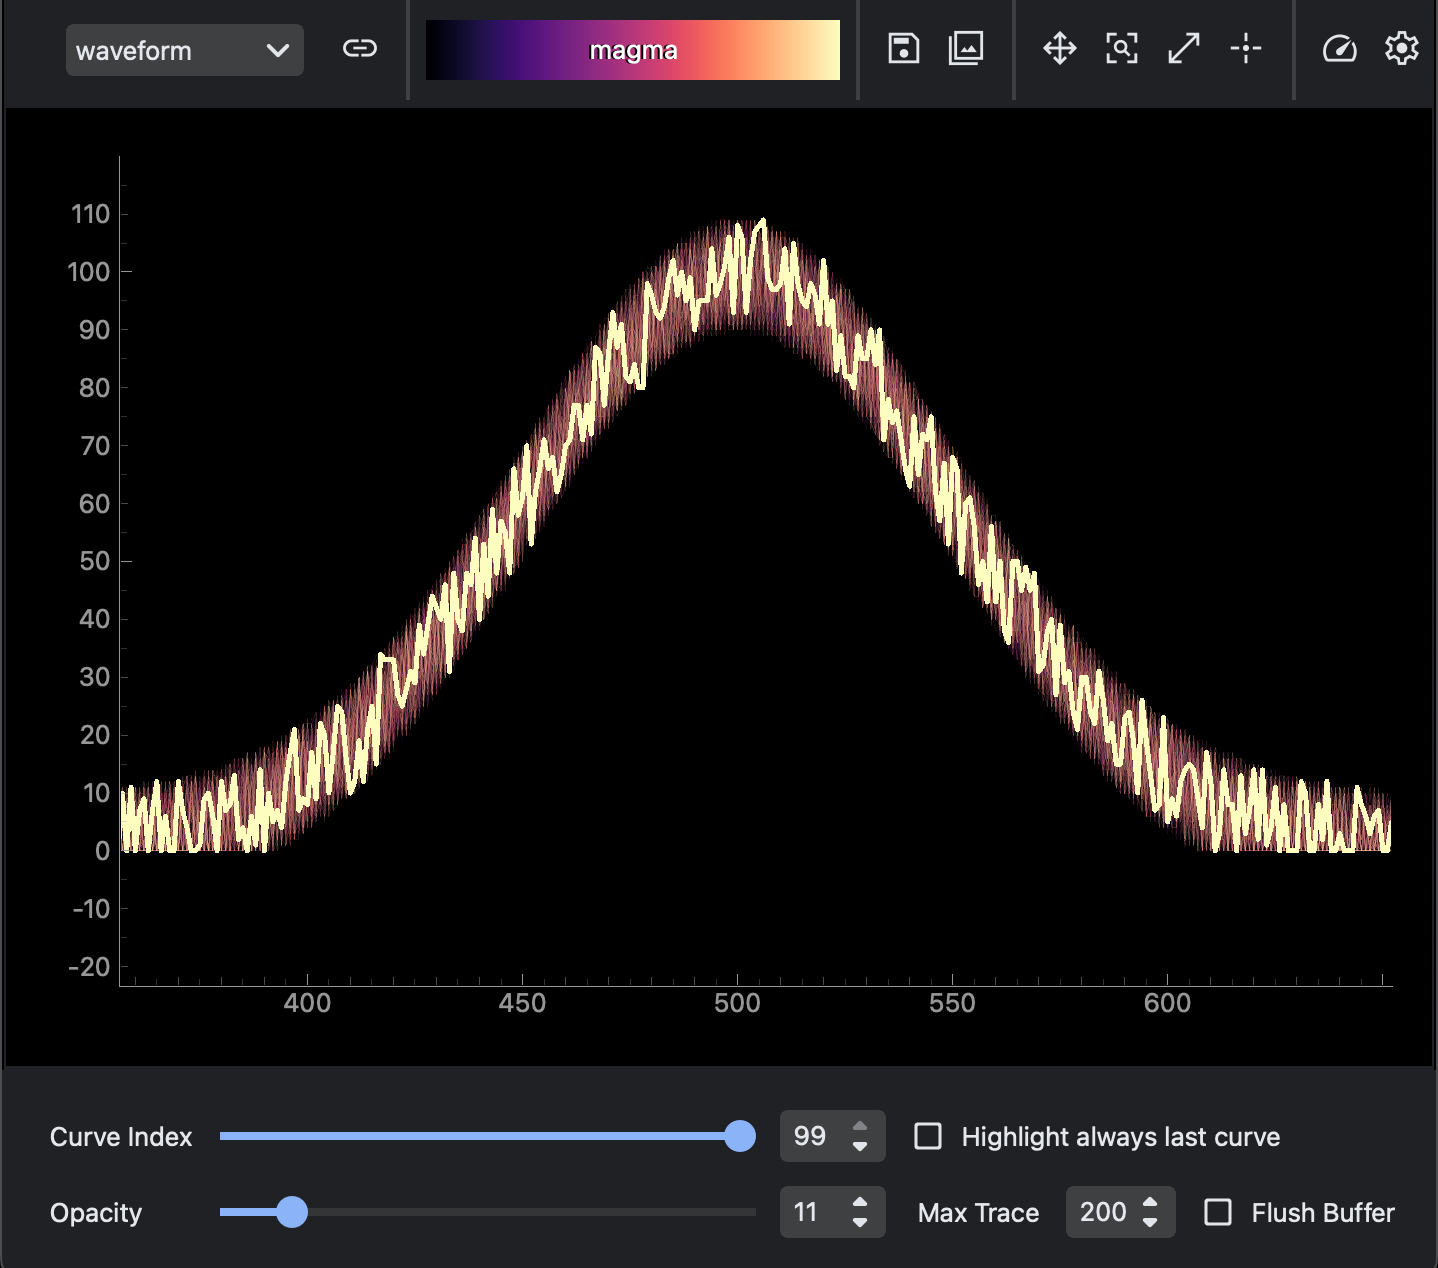
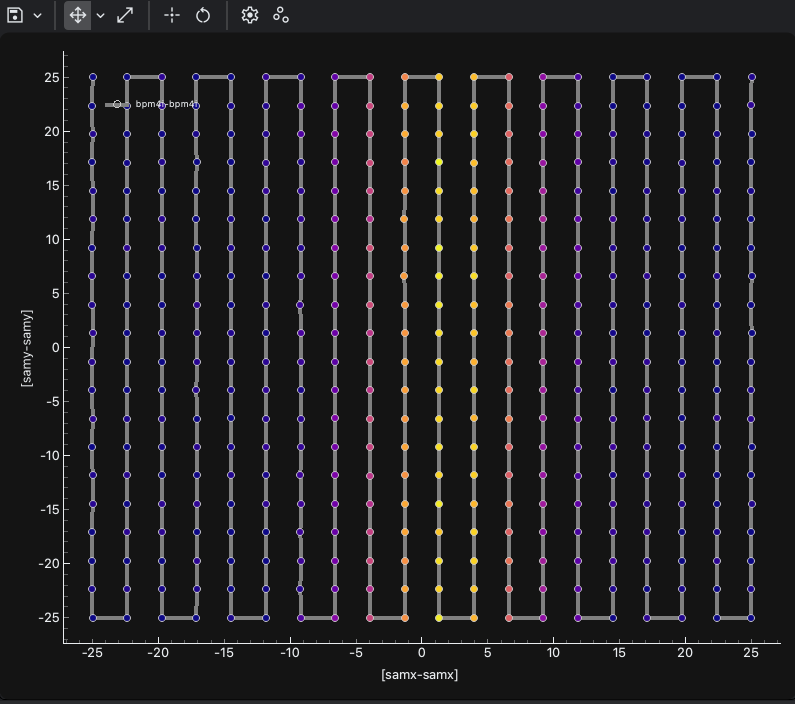
Plotting Widgets#
Plotting widgets are used to display data in a graphical format.
Display 1D detector signals.
Display multiple 1D waveforms.
Display a 1D waveforms with a third device on the z-axis.
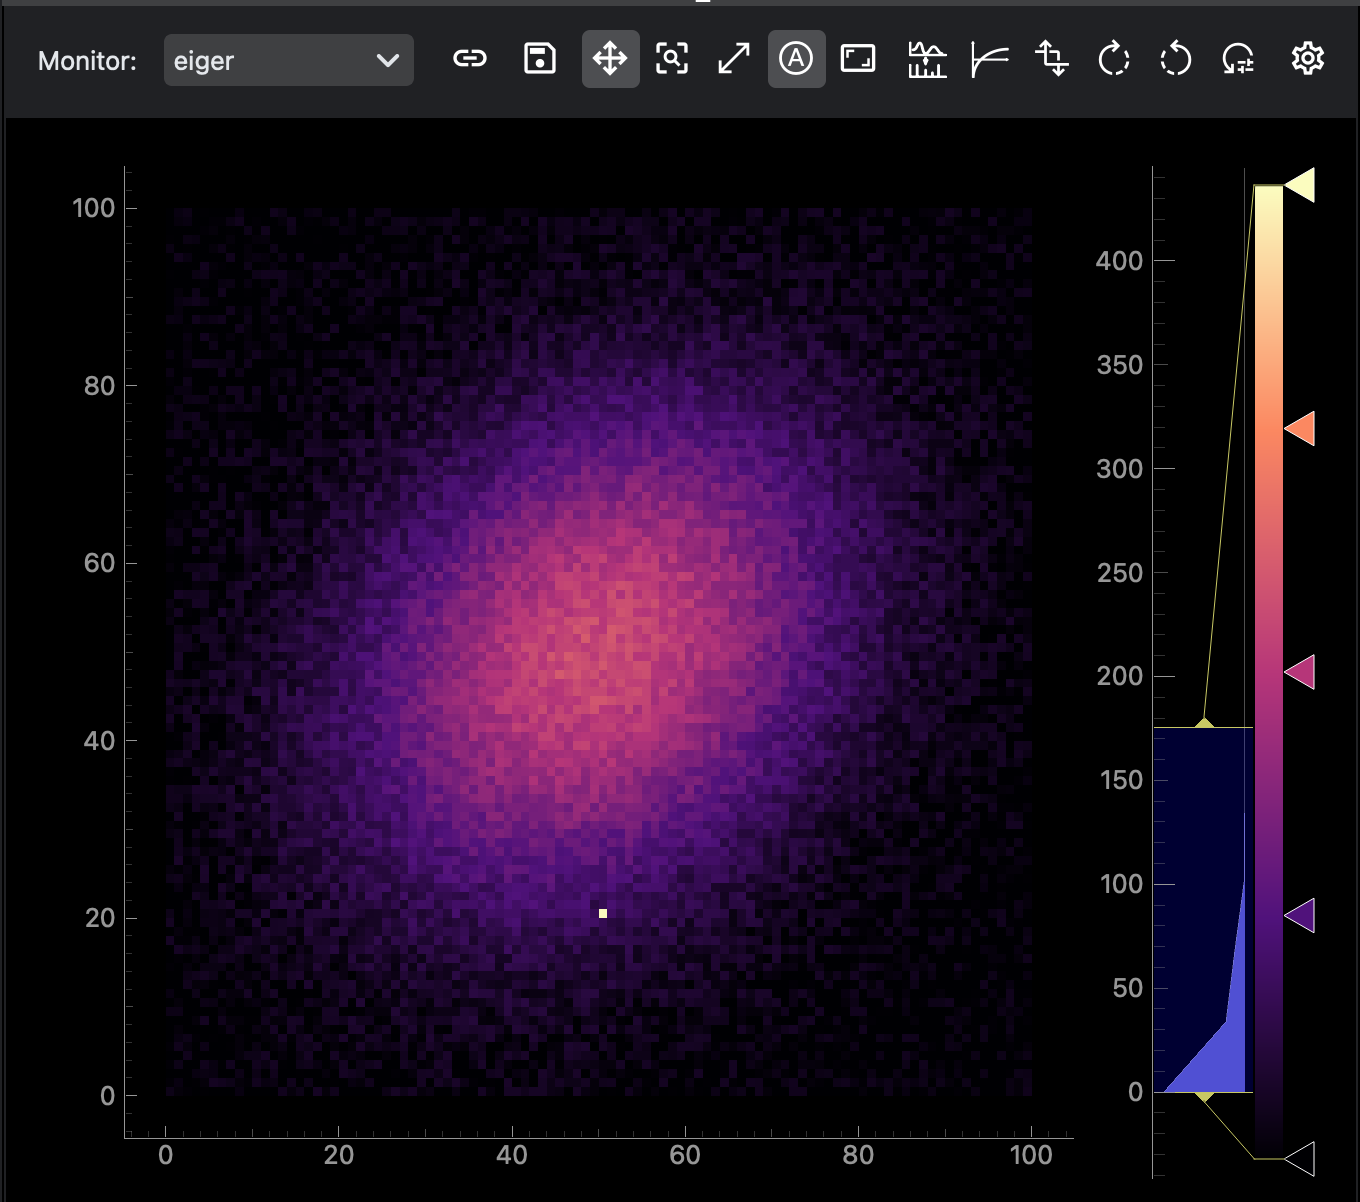
Display signal from 2D detector.
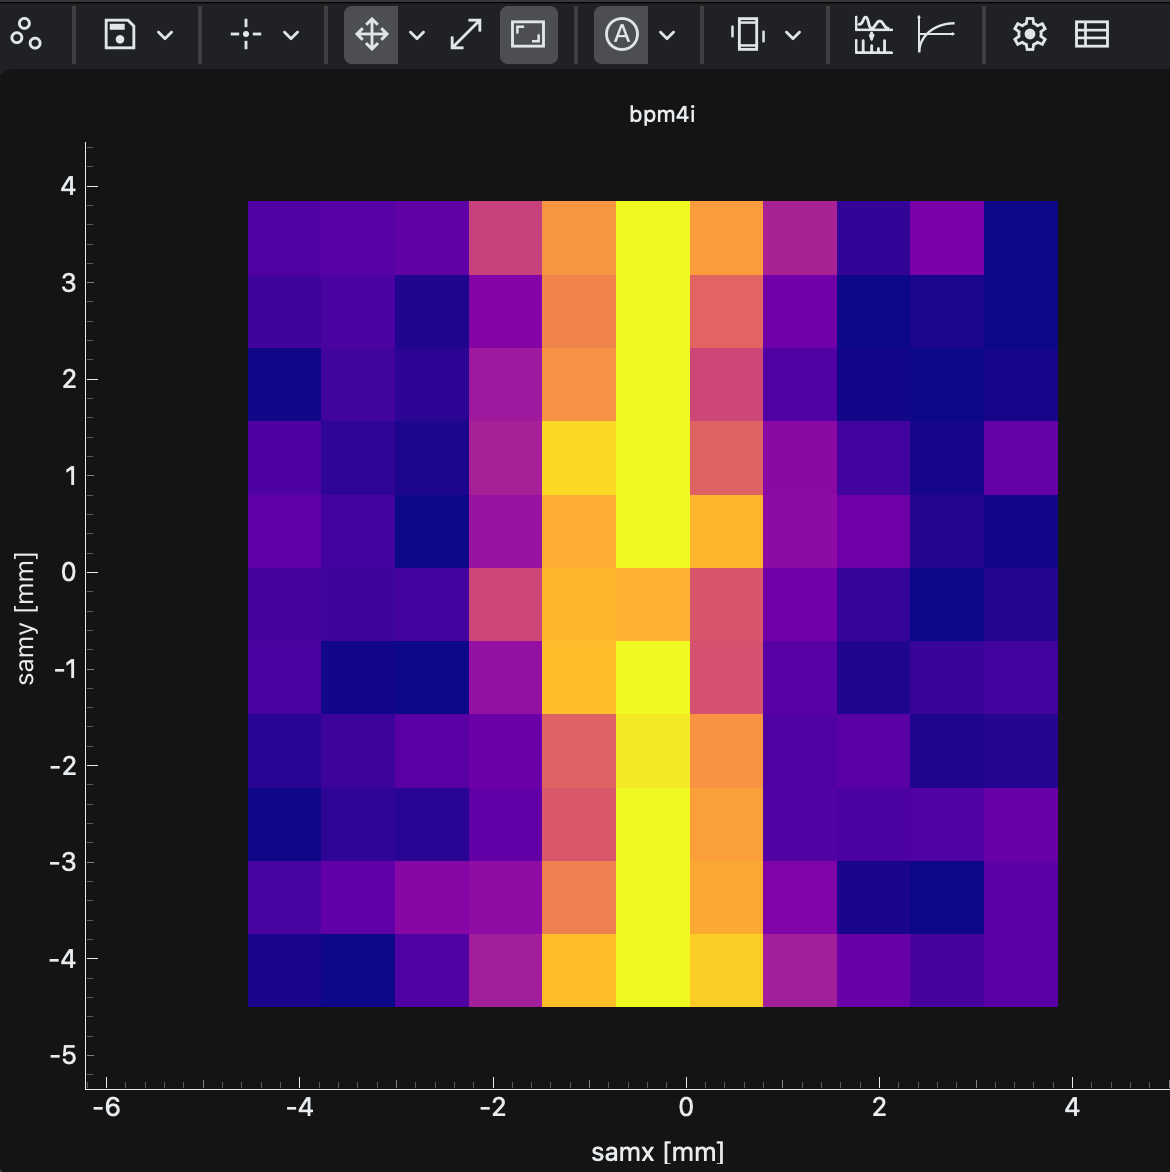
Display 2D grid data with color mapping.
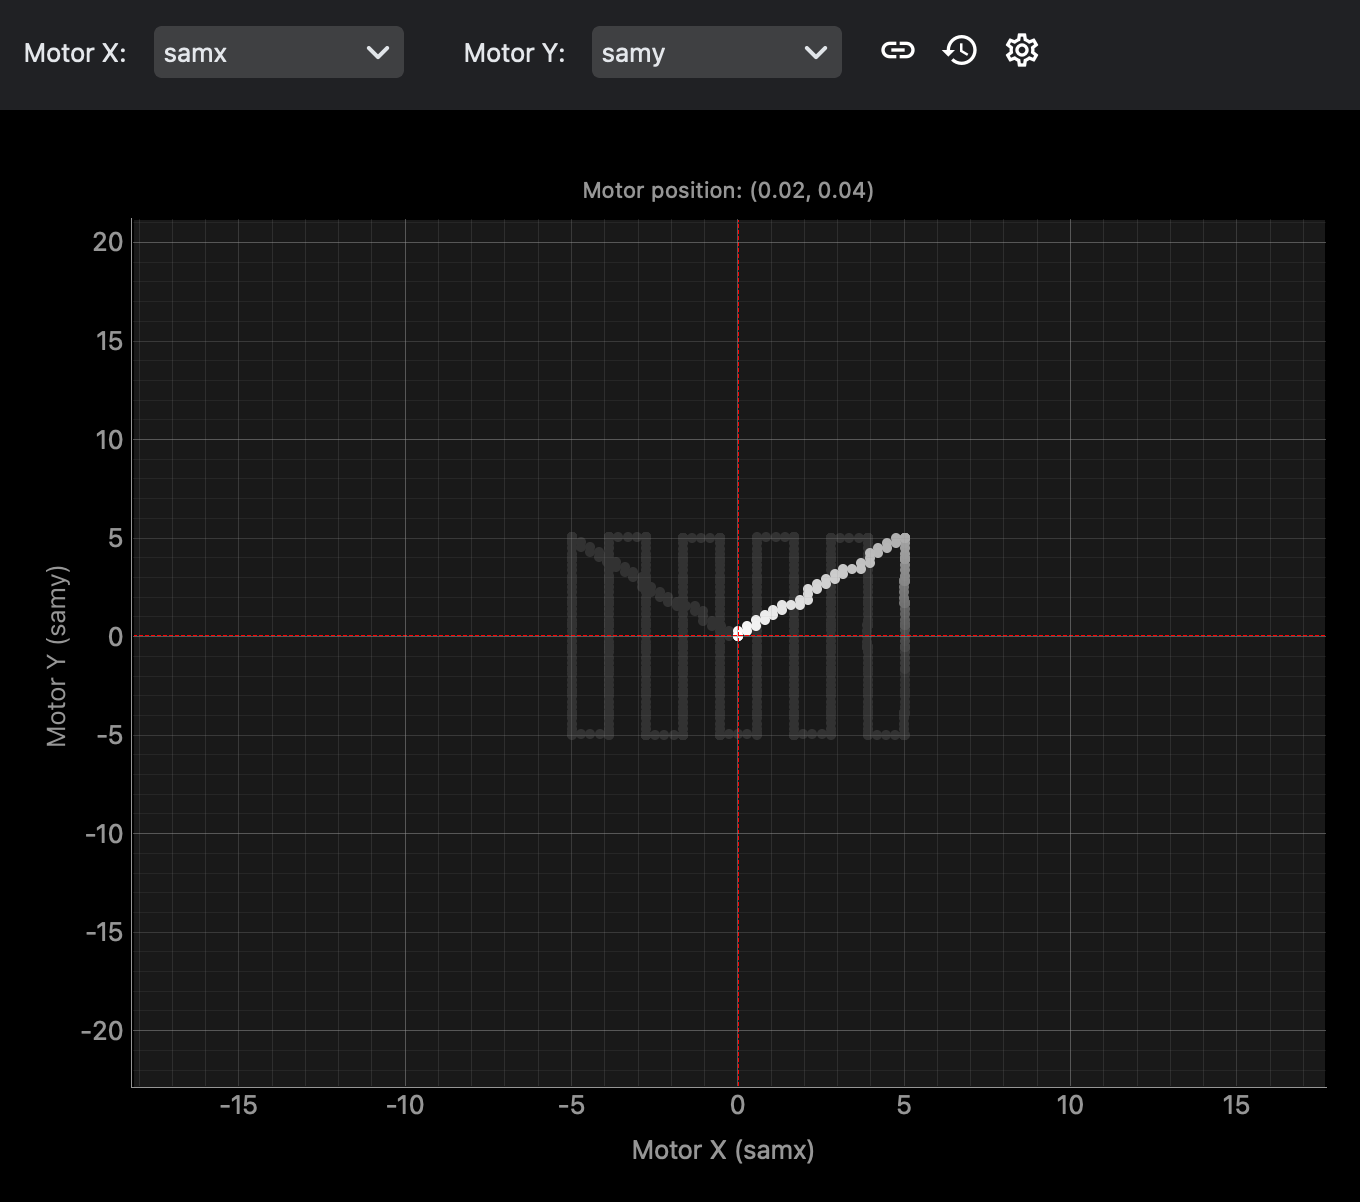
Track position for motors.
Device Control Widgets#
Control and monitor devices/scan in the BEC environment.
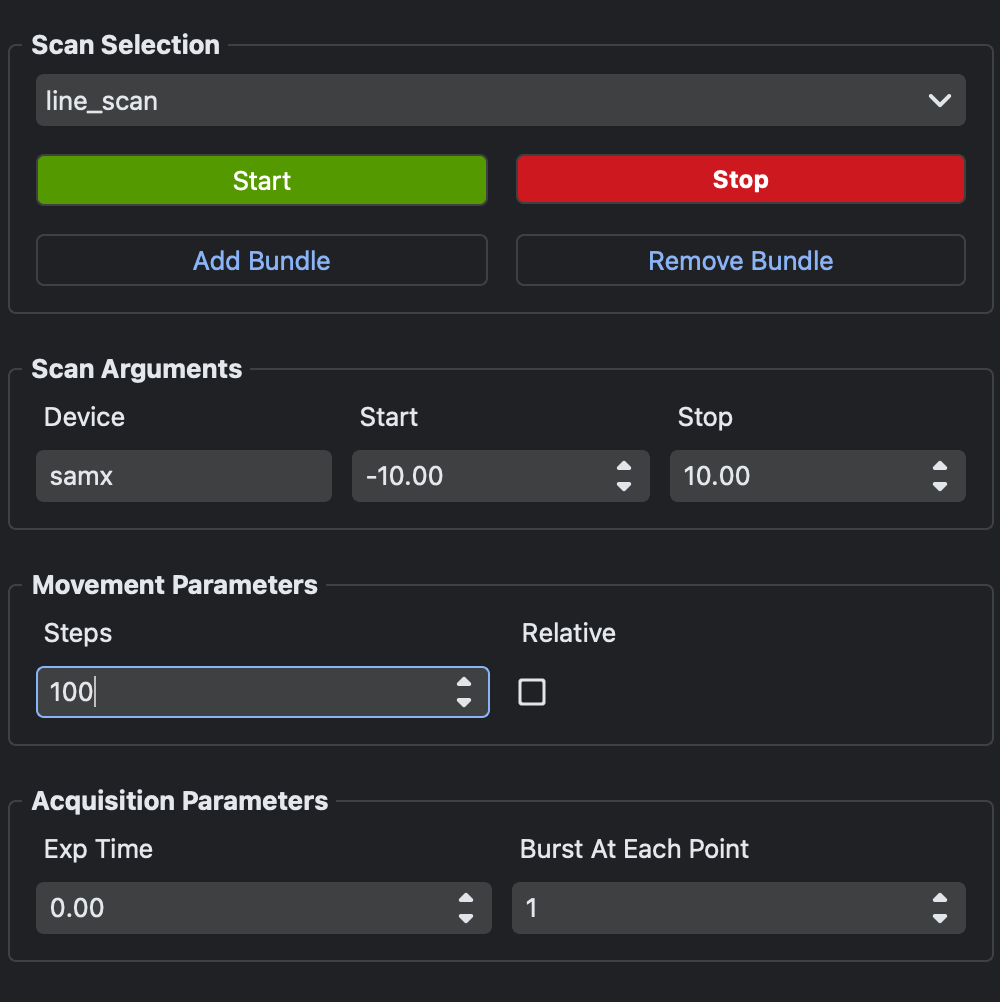
Launch scans.
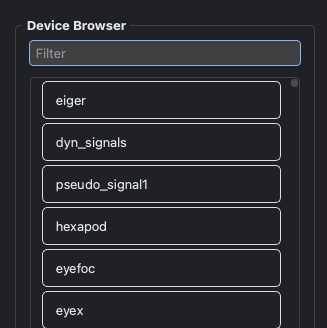
Find and drag devices.
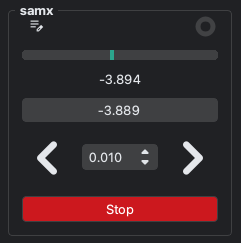
Control individual device.
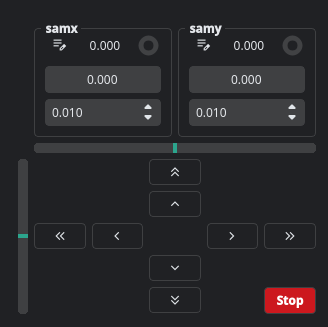
Control two individual devices on perpendicular axes.

Nested progress bar.
BEC Service Widgets#
Visualise the status of BEC services.
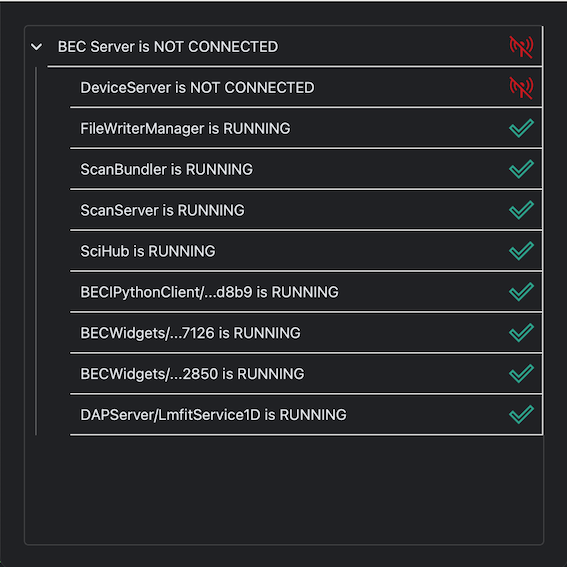
Display status of BEC services.
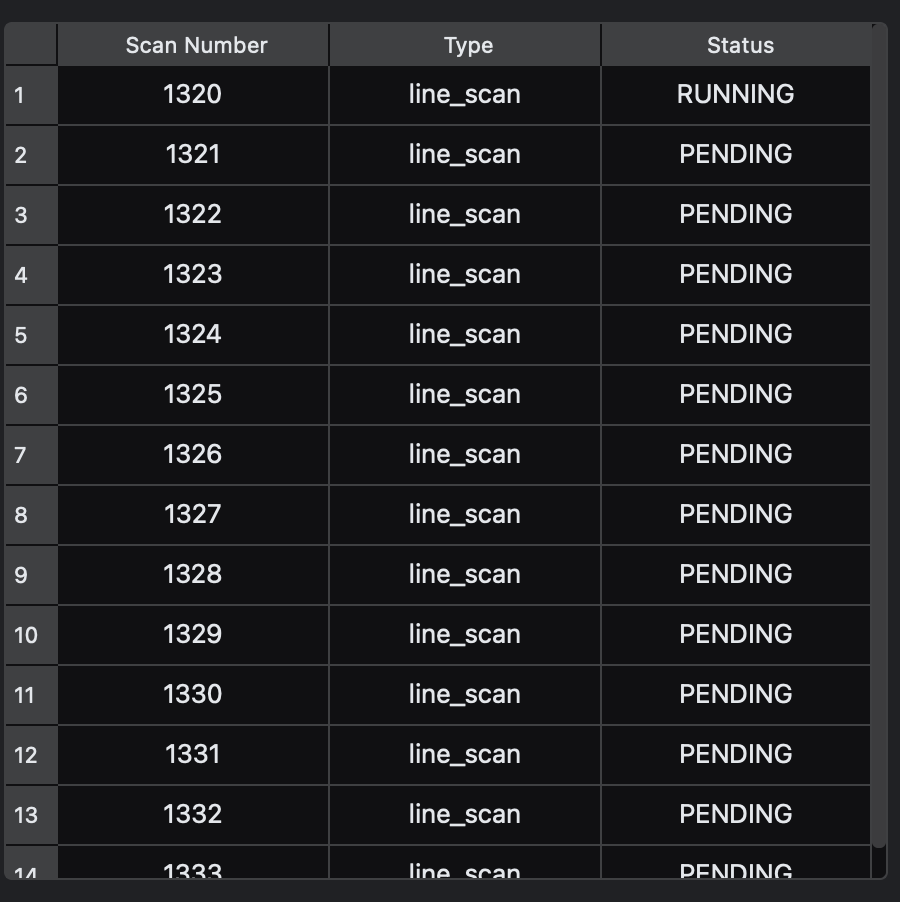
Display current scan queue.
BEC Utility Widgets#
Various utility widgets to enhance user experience.
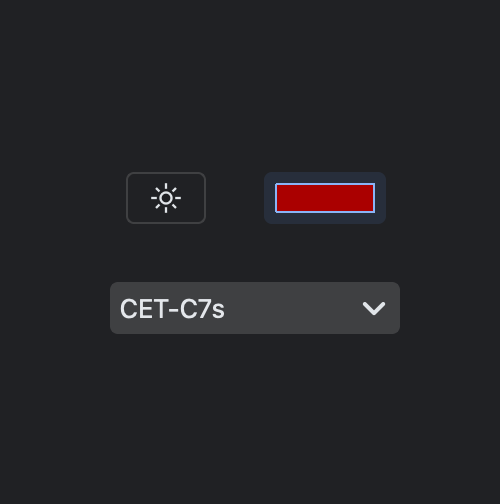
Various buttons which manage the appearance of the BEC GUI.
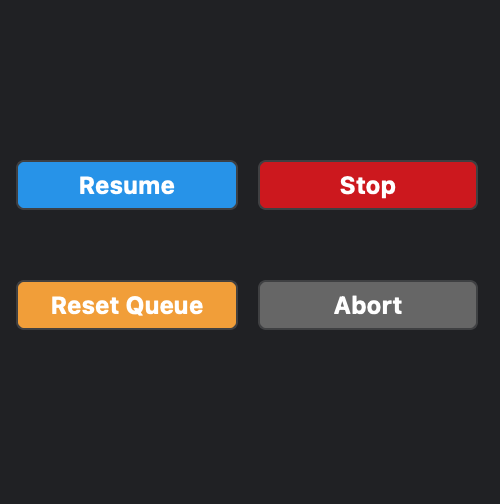
Various buttons which manage the control of the BEC Queue.
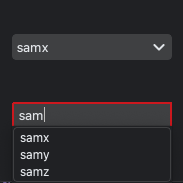
Choose individual device from current session.
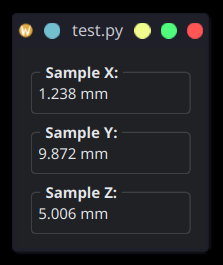
Display the live value of a signal.
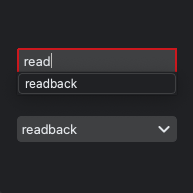
Choose individual signals available for a selected device.
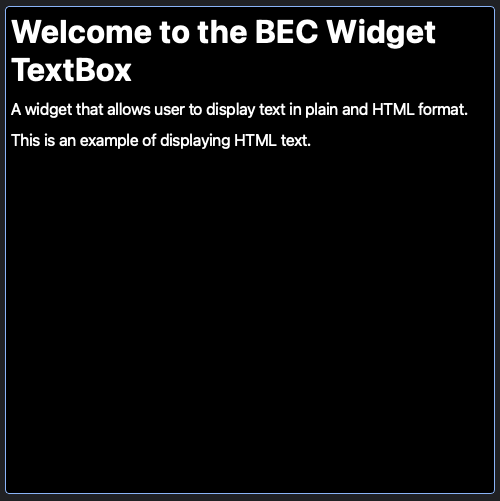
Display custom text or HTML content.
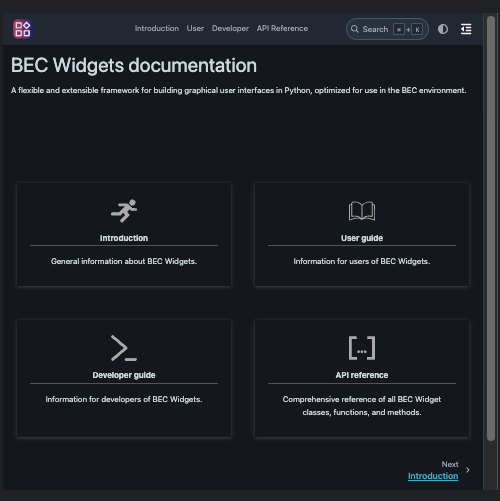
Display website content.
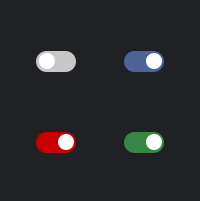
Angular like toggle switch.
Display spinner widget for loading or device movement.
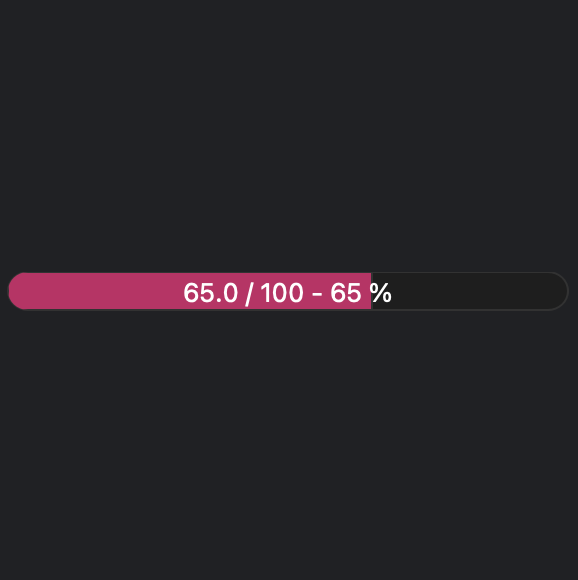
Modern progress bar for BEC.

Display position of motor within its limits.
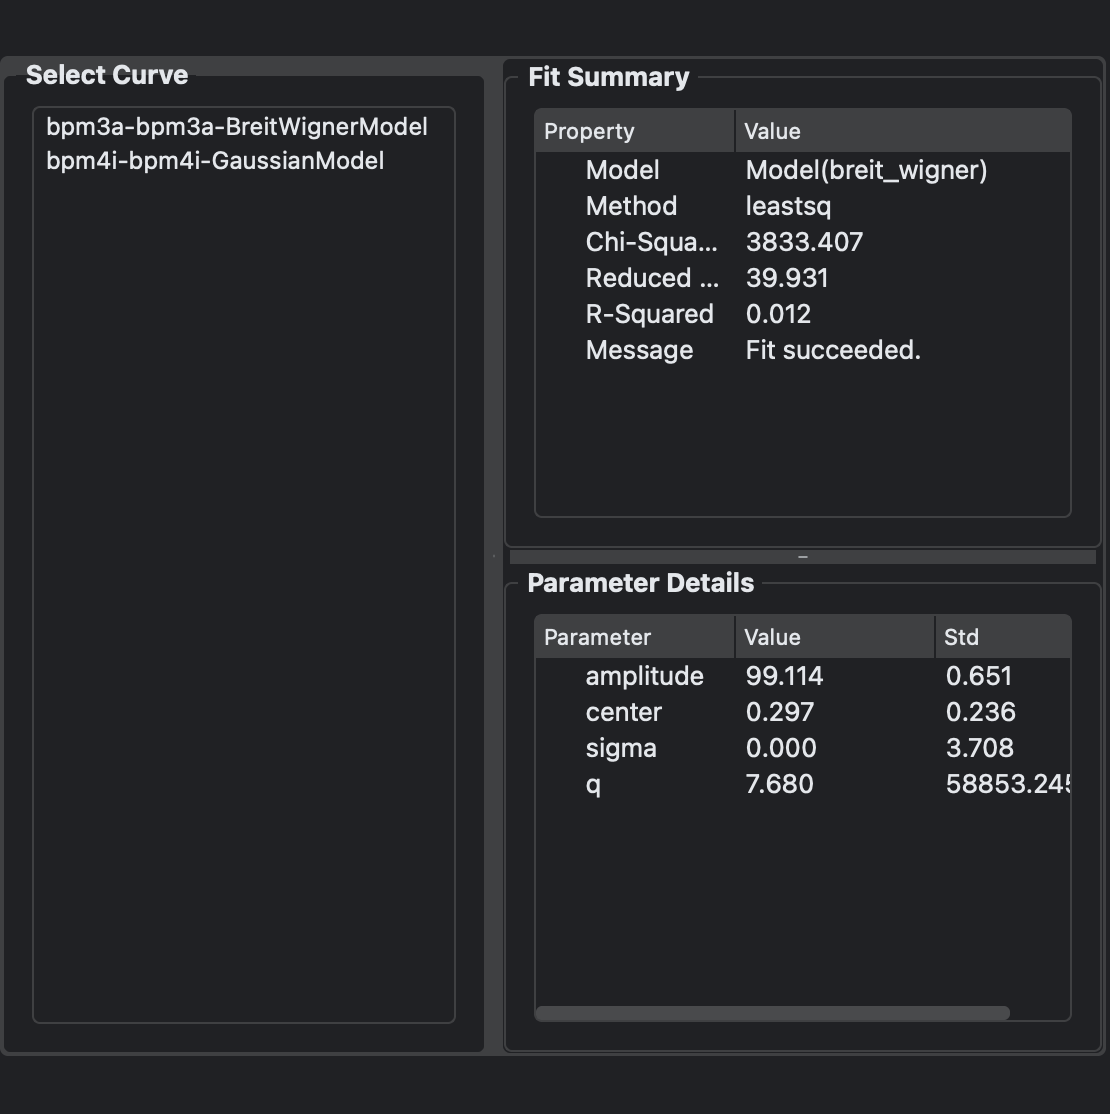
Display DAP summaries of LMFit models in a window.
Select DAP model from a list of DAP processes.
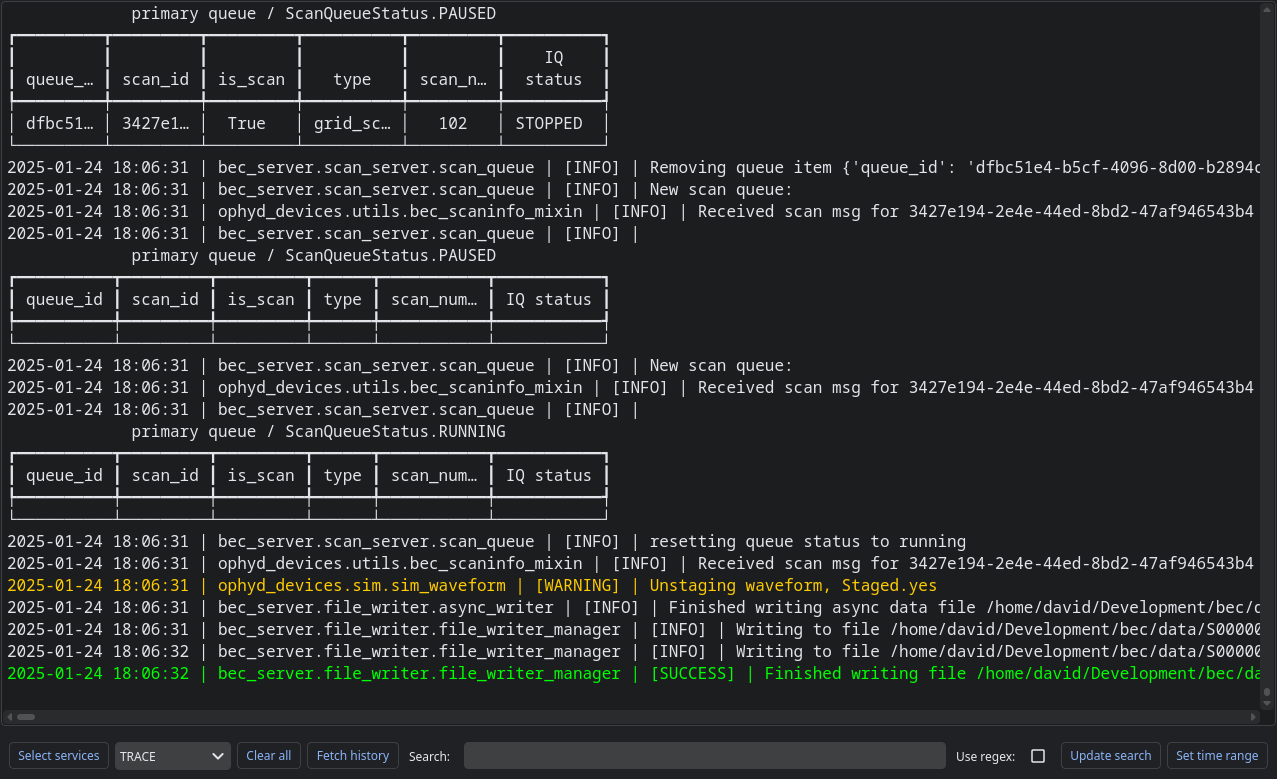
Show and filter logs from the BEC Redis server.
Display and navigate PDF documents.