Heatmap widget#
The Heatmap widget is a specialized plotting tool designed for visualizing 2D grid data with color mapping for the z-axis. It excels at displaying data from grid scans or arbitrary step scans, automatically interpolating scattered data points into a coherent 2D image. Directly integrated with the BEC framework, it can display live data streams from scanning experiments within the current BEC session.
Key Features:
Flexible Integration: The widget can be integrated into
BECDockArea, or used as an individual component in your application throughBEC Designer.Live Grid Scan Visualization: Real-time plotting of grid scan data with automatic positioning and color mapping based on scan parameters.
Dual Scan Support: Handles both structured grid scans (with pre-allocated grids) and unstructured step scans (with interpolation).
Intelligent Data Interpolation: For arbitrary step scans, the widget automatically interpolates scattered (x, y, z) data points into a smooth 2D heatmap using various interpolation methods.
Oversampling: Supports oversampling to enhance the appearance of the heatmap, allowing for smoother transitions and better visual representation of data. Especially useful the for nearest-neighbor interpolation.
Customizable Color Maps: Wide variety of color maps available for data visualization, with support for both simple and full color bars.
Real-time Image Processing: Apply real-time processing techniques such as FFT and logarithmic scaling to enhance data visualization.
Interactive Controls: Comprehensive toolbar with settings for heatmap configuration, crosshair tools, mouse interaction, and data export capabilities.
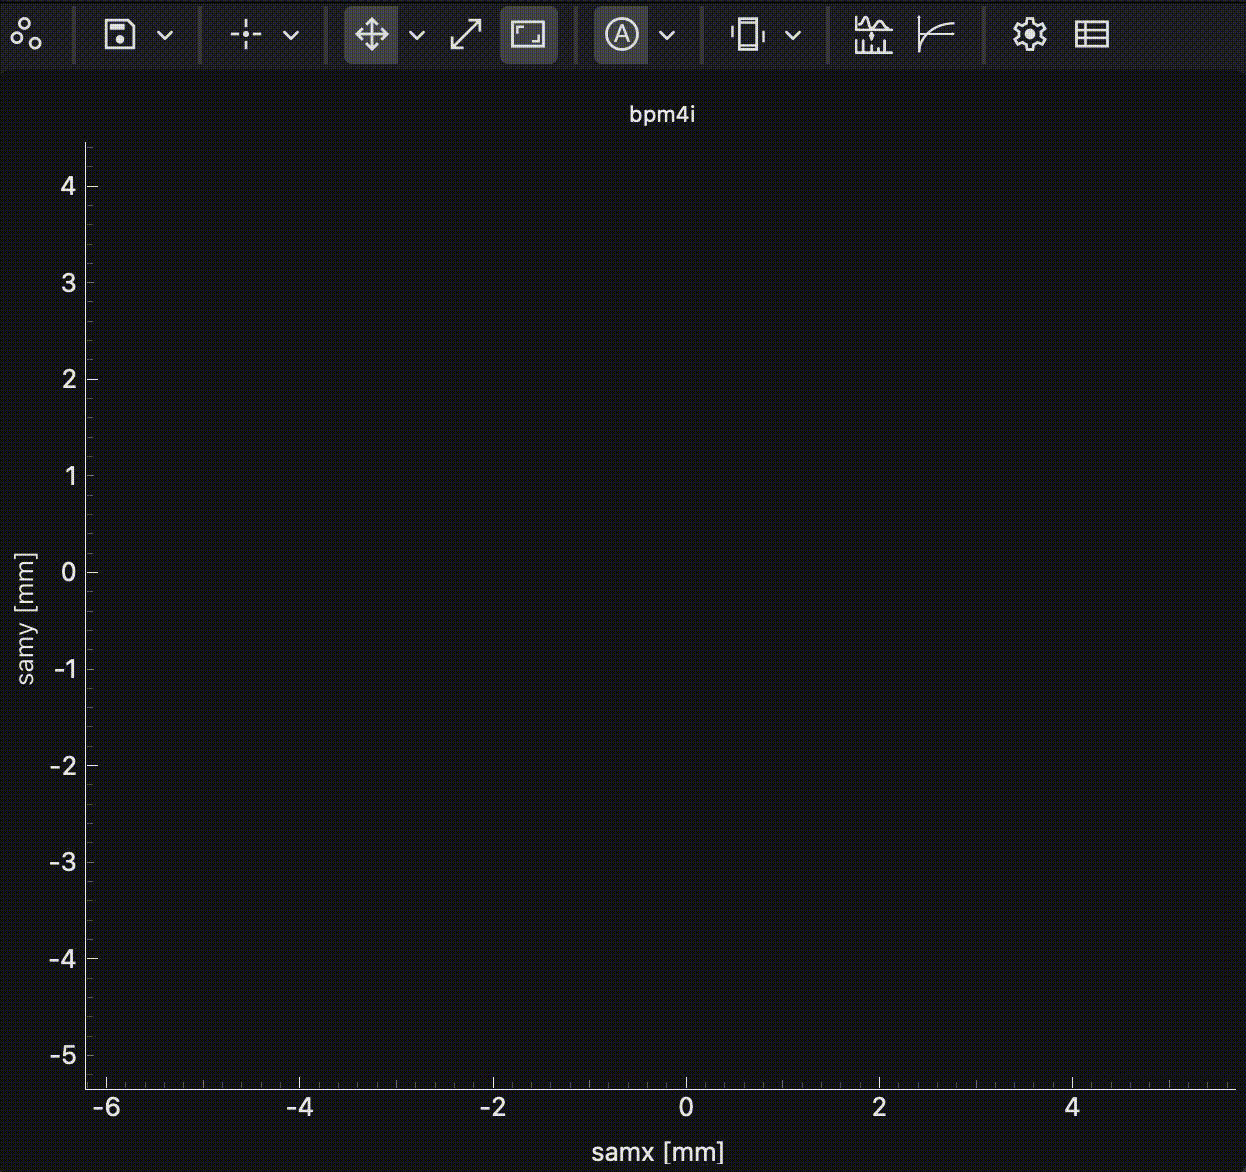
Real-time heatmap visualization of a 2D grid scan showing motor positions and detector intensity#
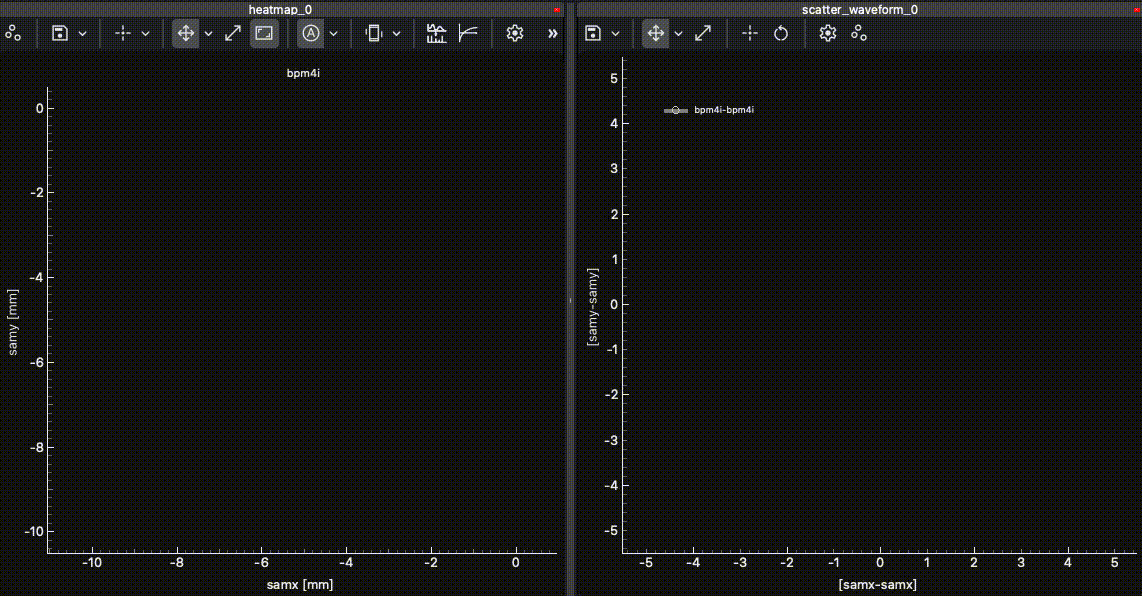
Real-time heatmap visualization of an (not path-optimized) scan following Fermat’s spiral pattern. On the left, the heatmap widget is shown with the oversampling option set to 10 and the interpolation method set to nearest neighbor. On the right, the scatter waveform widget is shown with the same data.#
HeatmapWidget can be embedded in BECDockArea, or used as an individual component in your application through BEC Designer. The command-line API is the same for all cases.
Example 1 - Visualizing Grid Scan Data
In this example, we demonstrate how to add a HeatmapWidget to visualize live data from a 2D grid scan with motor positions and detector readout.
# Add a new dock with HeatmapWidget
dock_area = gui.new()
heatmap_widget = dock_area.new().new(gui.available_widgets.Heatmap)

# Plot a heatmap with x and y motor positions and z detector signal
heatmap_widget.plot(
    device_x='samx',  # X-axis motor
    device_y='samy',  # Y-axis motor
    device_z='bpm4i', # Z-axis detector signal
    color_map='plasma'
)
heatmap_widget.title = "Grid Scan - Sample Position vs BPM Intensity"
Example 2 - Step Scan with Custom Entries
This example shows how to visualize data from an arbitrary step scan by specifying custom data entries for each axis.
# Add a new dock with HeatmapWidget
dock_area = gui.new()
heatmap_widget = dock_area.new().new(gui.available_widgets.Heatmap)

# Plot heatmap with specific data entries
heatmap_widget.plot(
    device_x='motor1',
    device_y='motor2',
    device_z='detector1',
    signal_x='RBV',      # Use readback value for x
    signal_y='RBV',      # Use readback value for y
    signal_z='value',    # Use main value for z
    color_map='viridis',
    reload=True         # Force reload of data
)
Example 3 - Real-time Processing and Customization
The Heatmap widget provides real-time processing capabilities and extensive customization options for enhanced data visualization.
# Configure heatmap appearance and processing
heatmap_widget.color_map = 'plasma'
heatmap_widget.lock_aspect_ratio = True

# Apply real-time processing
heatmap_widget.fft = True           # Apply FFT to the data
heatmap_widget.log = True           # Use logarithmic scaling

# Configure color bar and range
heatmap_widget.enable_full_colorbar = True
heatmap_widget.v_min = 0
heatmap_widget.v_max = 1000
- class Heatmap(parent=None, config: HeatmapConfig | None = None, **kwargs)[source]#
Bases:
ImageBaseHeatmap widget for visualizing 2d grid data with color mapping for the z-axis.
Initialize the ImageBase widget.
- static arg_bundle_to_dict(bundle_size: int, args: list) dict[source]#
Convert the argument bundle to a dictionary.
- Parameters:
bundle_size (int) – The size of each argument bundle.
args (list) – The argument bundle.
- Returns:
The dictionary representation of the argument bundle.
- Return type:
dict
- static build_image_grid(positions: ndarray, oversampling_factor: float) tuple[ndarray, ndarray, QTransform][source]#
Build an interpolation grid covering the data positions.
- Parameters:
positions – (N, 2) array of (x, y) coordinates
oversampling_factor – Grid resolution multiplier (>1.0 for higher resolution)
- Returns:
Tuple of (grid_x, grid_y, transform) where grid_x/grid_y are meshgrids for interpolation and transform maps pixel to world coordinates
- static compute_step_scan_image(x_data: list[float] | ndarray, y_data: list[float] | ndarray, z_data: list[float] | ndarray, oversampling_factor: float, interpolation_method: str) tuple[ndarray, QTransform][source]#
Compute interpolated heatmap image from step-scan data.
This static method is suitable for execution in a background thread as it doesn’t access any instance state.
- Parameters:
x_data (list[float]) – X coordinates of data points
y_data (list[float]) – Y coordinates of data points
z_data (list[float]) – Z values at each point
oversampling_factor (float) – Grid resolution multiplier (>1.0 for higher resolution)
interpolation_method (str) – One of ‘linear’, ‘nearest’, or ‘clough’
- Returns:
Tuple of (interpolated_grid, transform) where transform maps pixel to world coordinates
- Return type:
(tuple[np.ndarray, QTransform])
- device_x = <PySide6.QtCore.Property object>#
- device_y = <PySide6.QtCore.Property object>#
- device_z = <PySide6.QtCore.Property object>#
- enforce_interpolation = <PySide6.QtCore.Property object>#
- static estimate_image_resolution(coords: ndarray) tuple[int, int][source]#
Estimate the number of pixels needed for the image based on the coordinates.
- Parameters:
coords (np.ndarray) – The coordinates of the points.
- Returns:
The estimated width and height of the image.
- Return type:
tuple[int, int]
- fft = <PySide6.QtCore.Property object>#
- get_grid_scan_image(z_data: list[float], msg: ScanStatusMessage) tuple[ndarray, QTransform][source]#
Get the image data for a grid scan. :param z_data: The z data. :type z_data: np.ndarray :param msg: The scan status message. :type msg: messages.ScanStatusMessage
- Returns:
The image data and the QTransform.
- Return type:
tuple[np.ndarray, QTransform]
- get_image_data(x_data: list[float] | None = None, y_data: list[float] | None = None, z_data: list[float] | None = None) tuple[ndarray | None, QTransform | None][source]#
Get the image data for the heatmap. Depending on the scan type, it will either pre-allocate the grid (grid_scan) or interpolate the data (step scan).
- Parameters:
x_data (np.ndarray) – The x data.
y_data (np.ndarray) – The y data.
z_data (np.ndarray) – The z data.
- Returns:
The image data and the QTransform.
- Return type:
tuple[np.ndarray, QTransform]
- get_image_grid(positions) tuple[ndarray, ndarray, QTransform][source]#
LRU-cached calculation of the grid for the image. The lru cache is indexed by the scan_id to avoid recalculating the grid for the same scan.
- Parameters:
positions – positions of the data points.
- Returns:
The grid x and y coordinates and the QTransform.
- Return type:
tuple[np.ndarray, np.ndarray, QTransform]
- get_step_scan_image(x_data: list[float], y_data: list[float], z_data: list[float]) tuple[ndarray, QTransform][source]#
Get the image data for an arbitrary step scan.
- Parameters:
x_data (list[float]) – The x data.
y_data (list[float]) – The y data.
z_data (list[float]) – The z data.
- Returns:
The image data and the QTransform.
- Return type:
tuple[np.ndarray, QTransform]
- interpolation_method = <PySide6.QtCore.Property object>#
- log = <PySide6.QtCore.Property object>#
- num_rotation_90 = <PySide6.QtCore.Property object>#
- on_scan_status(msg: dict, meta: dict)[source]#
Initial scan status message handler, which is triggered at the begging and end of scan.
- Parameters:
msg (dict) – The message content.
meta (dict) – The message metadata.
- oversampling_factor = <PySide6.QtCore.Property object>#
- plot(device_x: str, device_y: str, device_z: str, signal_x: None | str = None, signal_y: None | str = None, signal_z: None | str = None, color_map: str | None = 'plasma', validate_bec: bool = True, interpolation: Literal['linear', 'nearest'] | None = None, enforce_interpolation: bool | None = None, oversampling_factor: float | None = None, lock_aspect_ratio: bool | None = None, show_config_label: bool | None = None, reload: bool = False)[source]#
Plot the heatmap with the given x, y, and z data.
- Parameters:
device_x (str) – The name of the x-axis device signal.
device_y (str) – The name of the y-axis device signal.
device_z (str) – The name of the z-axis device signal.
signal_x (str | None) – The entry for the x-axis device signal.
signal_y (str | None) – The entry for the y-axis device signal.
signal_z (str | None) – The entry for the z-axis device signal.
color_map (str | None) – The color map to use for the heatmap.
validate_bec (bool) – Whether to validate the entries against BEC signals.
interpolation (Literal["linear", "nearest"] | None) – The interpolation method to use.
enforce_interpolation (bool | None) – Whether to enforce interpolation even for grid scans.
oversampling_factor (float | None) – Factor to oversample the grid resolution.
lock_aspect_ratio (bool | None) – Whether to lock the aspect ratio of the image.
show_config_label (bool | None) – Whether to show the configuration label in the heatmap.
reload (bool) – Whether to reload the heatmap with new data.
- signal_x = <PySide6.QtCore.Property object>#
- signal_y = <PySide6.QtCore.Property object>#
- signal_z = <PySide6.QtCore.Property object>#
- transpose = <PySide6.QtCore.Property object>#